The affinity diagram (also known as the “affinity chart,” “affinity mapping,” “K-J Method,” or “thematic analysis”) is one of the Seven Management and Planning Tools developed by Japanese anthropologist Jiro Kawakit in the 1960s.
The affinity diagram groups a large number of ideas according to their relationship with each other. Businesses use various idea collection techniques such as brainstorming sessions, facilitated workshops, etc., and then categorize them using an affinity diagram.
The affinity diagram is useful for brainstorming ideas and sorting research data.
You can use an affinity diagram for the following reasons:
Here are some examples of when you can use an affinity diagram:
You can follow the following step-by-step process to create an affinity diagram:
This is the first step to create the affinity diagram. You must clearly define the exercise’s objective and the problem you want to address during the session. The objective can be developing a new product, improving an existing process, or finding a solution to an existing problem.
You will now call your participant and have a brainstorming session to generate a list of ideas, opinions, or any information related to the topic. Instruct participants to write only one idea on one card.
You can distribute the cards or sticky notes to each participant in advance. Make sure they write ideas clearly on the card using their pens or markers.
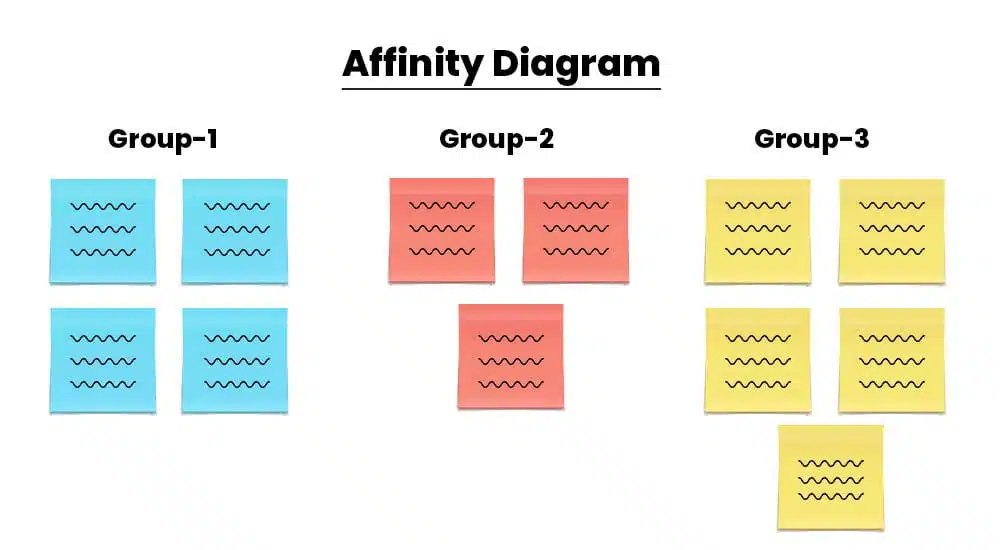
After collecting ideas, spread the cards on a table or board so all participants can see them. This makes it easier to move and organize the ideas. Begin grouping similar ideas. Look for common themes or connections among the ideas. Move the cards around to form clusters of related items.
After forming the group, assign a label or category to represent the common theme of that group. Write the label on a separate card or note and place it near the grouped ideas. Alternatively, you can write this information on the board with a marker.
Continue grouping similar ideas and labeling the groups until all the ideas have been organized. You can create subgroups if needed.
Once the organization is completed, create the final affinity diagram. This could involve photographing the physical arrangement or transferring the information to a digital format.
Show the affinity diagram to stakeholders. Discuss the patterns, insights, and implications that emerge from the organized information.
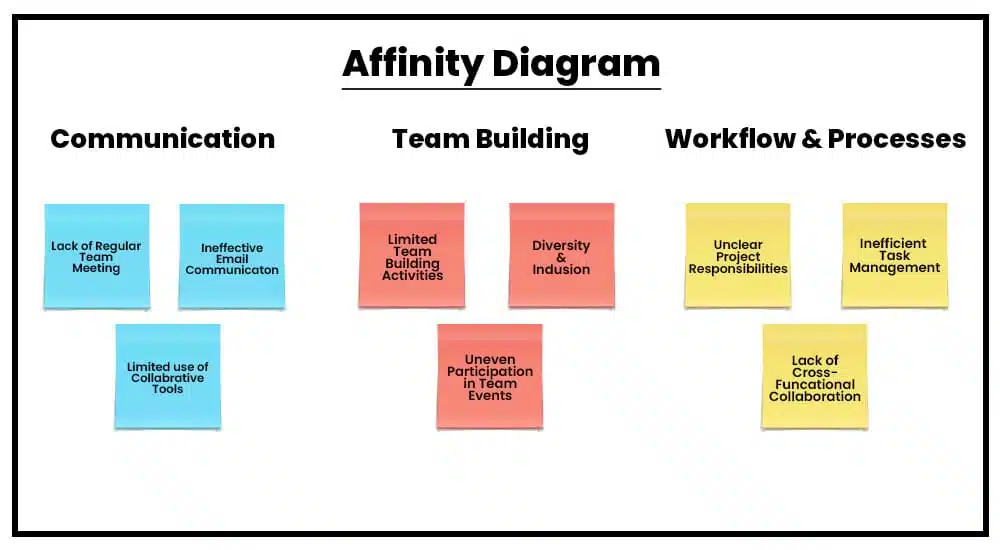
Now, we will see an affinity diagram to improve team collaboration:
The following are a few limitations of an affinity diagram:
Affinity diagrams help cluster large volumes of information logically, using natural relationships. It is a flexible idea-grouping tool that can be adapted to suit your needs as well as the problem’s complexity. It is a collaborative exercise, so ensure that you encourage active participation from all team members.